For those of you already experiencing the benefits of SalesLogix Visual Analyzer, here are some helpful instructions.
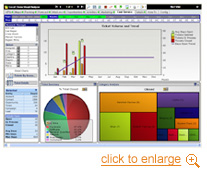
KPI Dashboard:
Scenario:
You are a manager and have several people reporting to you. To view an individual’s data, select their name from the Rep Name selection field. You will see the screen data change to reflect the selected Rep. To clear your selections, click on the same rep's name again, or click the Clear button on the toolbar.
To navigate to a different tab, select the Details button under each gauge, or click on the desired tab name.
You can export most grids and charts to Excel or other Office applications. Right-click on the grid and chart, then select Send to Excel, or Copy to Clipboard. If you Copy to Clipboard you can then paste in most other Windows applications.
Making Selections
To make a selection, click on the item you are interested in. You can click and drag, or use the CTRL+Click to make multiple selections. Selections can also be made by clicking on Buttons, as well as Click and Drag on charts.