For those of you already experiencing the benefits of SalesLogix Visual Analyzer, here are some helpful instructions.
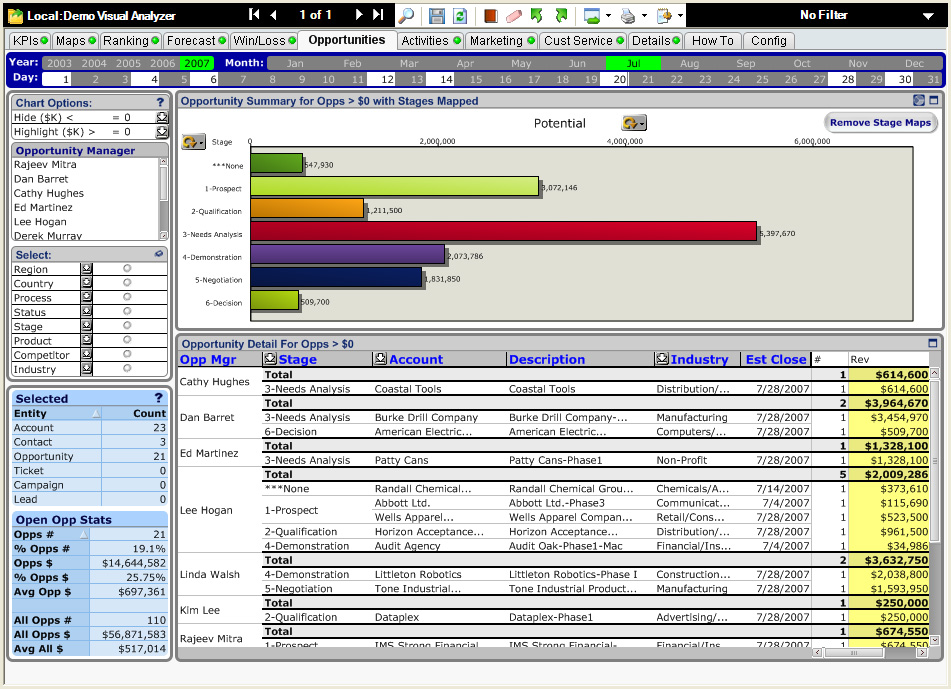
Opportunities Scenario:
You want to highlight all opportunities over $500,000 that are in
Stage 3 or Stage 4 of your sales process.
| 1. |
Click the drop down arrow in Chart Options next to Highlight ($K) >, and select 500. |
| 2. |
Using your mouse, move the cursor over the chart, then right-click and hold, then drag the mouse to highlight the bar for Stage 3 and Stage 4 opportunities. |
You will now see all opportunities over $500,000 highlighted, and only those opportunities that are in Stage 3 or Stage 4. Now you can either export that list to Excel, or use the Goto command to build a Sage SalesLogix group of those opportunities.
Forecasting Scenario:
Say you want to see all deals for Q3 and Q4 of this year, with a close of more than 50%. To make the big deals stand out a little more, you also want to highlight all deals with a sales potential greater than $700,000.
Stage 3 or Stage 4 of your sales process.
| 1. |
Click Year 2009, then click and drag Jul through Dec (or your can click and drag the Q3 and Q4 on the chart). |
| 2. |
Click the little down arrow in the Highlight field and select 700, then select 50 from the Show Close% field. |
That’s it. Now you can either export that list to Excel, or use the Goto command to build a Sage SalesLogix group of those opportunities.